the prevention paradox:
PROVING THE VALUE OF PREVENTATIVE TECHNOLOGY IN MINING
Reliability teams face a real challenge: demonstrating the value of investing in preventative maintenance technologies.
Using two years of operating data from a large haul truck fleet on Australia’s East Coast, our ROI Calculator and an NNT (Number Needed to Treat) framework, our Whitepaper concludes that a single asset validates the technology. A fleet captures the value.

the $1.76 million issue
A mining operator on Australia’s East Coast runs a 50-truck fleet moving 35M+ tonnes of coal a year. The rear axle component of their haul trucks are failing prematurely for 2 years straight.
Here are some of our findings from their operational data:
Premature failure is the norm
The average component was replaced at 11,972 SMU (Service Meter Units), which is 61% of the 20,000-hour design life. The fleet was losing nearly 40% of available component life on average, representing significant unrealised capital.
High cost variance per event
Individual repair costs ranged from under A$10,000 to nearly A$200,000 per event. This spread means that averages, while useful for planning, can mask the severity of the worst outcomes. Any single failure has the potential to be a costly event.
Repair costs alone understate the true economic impact
At A$1,300 per hour of production value, per truck, and an average downtime of 215 hours per event, the production loss associated with each failure substantially exceeds the direct repair invoice.
The total annualised production loss across the fleet was calculated at A$732,221, in addition to the A$881,512 in annualised direct repair costs.
see A$881KRepair cost(annual)
the prevention paradox
how do you measure the value of a failure that was prevented?
Reliability technology is invisible when it’s working perfectly. It ensures seamless operation, creating an unwritten history of performance. No record, just results.
Single-asset data is ambiguous. It’s impossible to distinguish between technology effectiveness and mere luck.
Two explanations fit the same observation: the technology is working, or the truck is simply on borrowed time. The data alone can’t tell you which — until you add scale.
NON-Failures ARE INVISIBLE
A prevented failure does not leave a repair history, repair costs, or any traceable record.

The attribution problem
How does a preventative technology prove its worth statistically?

scale is the solution
As monitored assets increase, variance falls and the difference between pre- and post-intervention failure rates becomes meaningful.
INTERACTIVE COMPANION TOOL
HOW MUCH CAN YOU
SAVE PER YEAR?
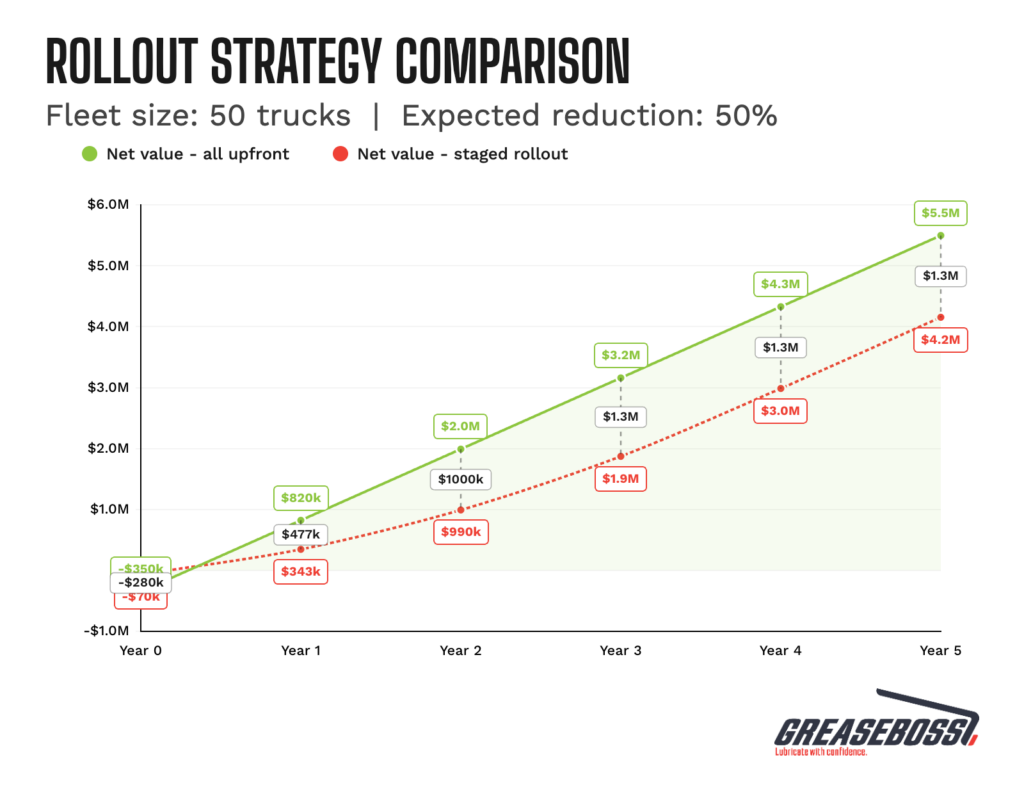
Our Fleet Risk Model takes your data and simulates cost & savings related to reliability initiatives like GreaseBoss. Enter your fleet size, cost assumptions and rollout timing to size avoided losses and compare strategies in detail.
You can even share and save the data with your team.

WHAT’S INSIDE
why proving the value of preventive maintenance technologies is difficult
NEW METHODOLOGIES TO MEASURE THE VALUE OF PREVENTATIVE MAINTENANCE TECHNOLOGIES
the real cost of premature failures in a tier 1 mining fleet
the fleet risk model and rollout strategy comparison
world leader in grease verification technology
trusted by australia’s largest operators
