
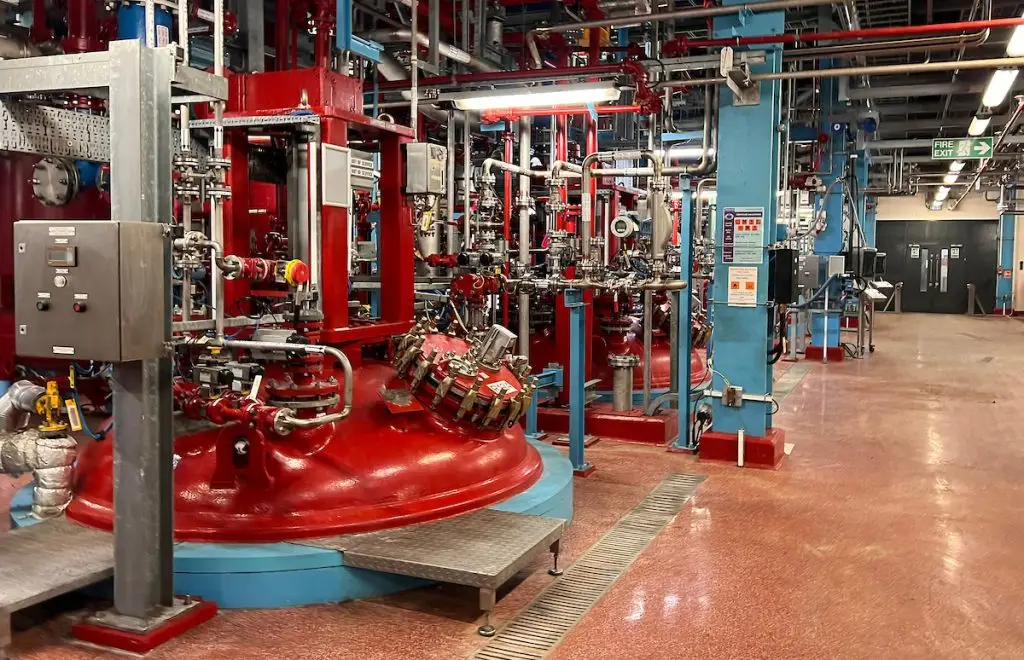
Consider a blocked injector on a single conveyor pulley bearing that goes undetected for three weeks. By the time the maintenance team finds it, the bearing has seized, the line is down for days and the repair bill runs to six figures. The PM schedule said the bearing was being greased. Nothing measured whether it was.
Across manufacturing, this gap between scheduled maintenance and verified maintenance is where preventive maintenance compliance breaks down. Most plants report compliance as the share of PM tasks closed on time. A closed task records that work was done. It does not record that grease reached the bearing.
This guide covers how to build a preventive maintenance schedule that holds up on the plant floor: ranking assets, choosing triggers, setting intervals, verifying lubrication and tracking the KPIs that show your programme is working.
Key takeaways
- Preventive maintenance compliance usually measures closed work orders, not outcomes. A 100% compliance figure can hide bearings that are not getting grease.
- Lubrication tasks should anchor the PM schedule, because grease-related faults such as blocked injectors and empty tanks are silent until a bearing fails.
- Build the schedule around failure modes and asset criticality, not calendar habit.
- GreaseBoss verifies lubrication at the point of lubrication, turning assumed compliance into measured planned vs actual data.
- Verified lubrication data gives maintenance supervisors early warning before bearing failures stop a line.
What is preventive maintenance compliance?
Preventive maintenance compliance is the share of scheduled PM tasks completed within their due window. It sits on top of the PM schedule itself: the plan that assigns routine tasks such as lubrication, filter changes, belt inspections and alignment checks to time intervals, usage thresholds or condition triggers before a failure occurs.
A good schedule moves maintenance into planned windows, so production stops on your terms rather than the equipment’s. Without one, plants default to reactive work. Parts run to failure, emergency labour costs climb and the same components fail again because nobody tracks the pattern.
Why lubrication anchors every PM schedule
Incorrect lubrication is one of the most cited causes of mechanical failure. Shell has put the figure at around 70% of mechanical failures. Whatever the exact share, lubrication tasks are the ones most likely to fail silently.
A bypassing injector delivers too little grease for weeks before a bearing overheats. An empty grease tank goes unnoticed until the next inspection. A mistuned pump timer under-greases half a circuit without raising an alarm. Each of these faults is preventable, but only if the schedule checks that grease was delivered, not just that the task was signed off.
Assumed vs verified lubrication
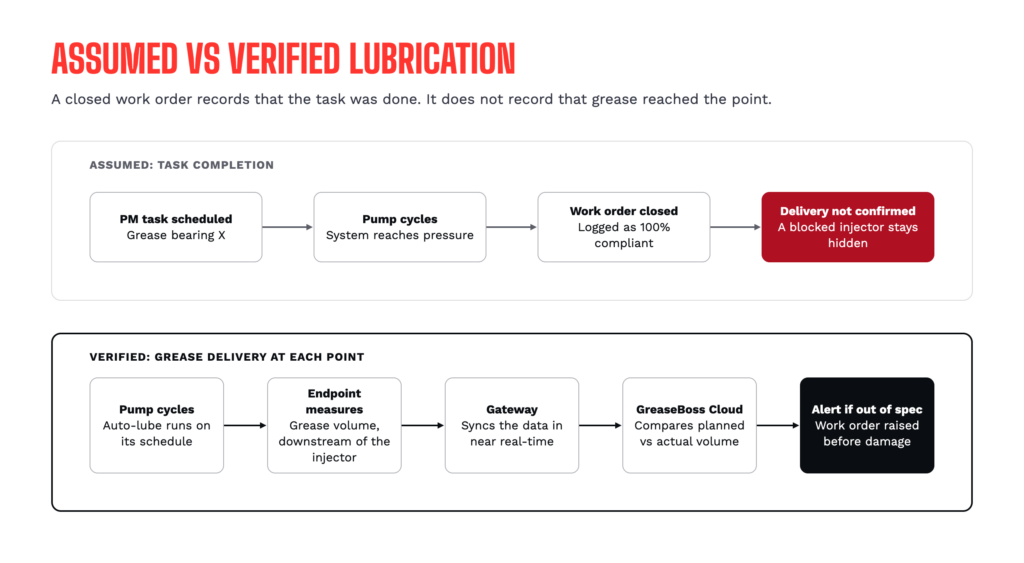
Most PM schedules treat lubrication as a checkbox. The task says “grease bearing X”, the technician closes it, and compliance reads 100%. That figure says nothing about whether grease reached the bearing.
Pump pressure does not confirm delivery either. A pump can reach full operating pressure while a blocked injector stops any grease reaching its point. Auto-lube monitoring that only tracks system pressure gives a false sense of compliance.
Verified lubrication means measuring the volume of grease delivered at each monitored point and comparing it against the planned volume. GreaseBoss Critical Point Monitoring does this with an Endpoint installed downstream of the injector. In effect, it runs a digital balloon test on every pump cycle: the same check a fitter makes by watching grease fill a balloon on the line, done automatically and recorded.
Four types of preventive maintenance triggers
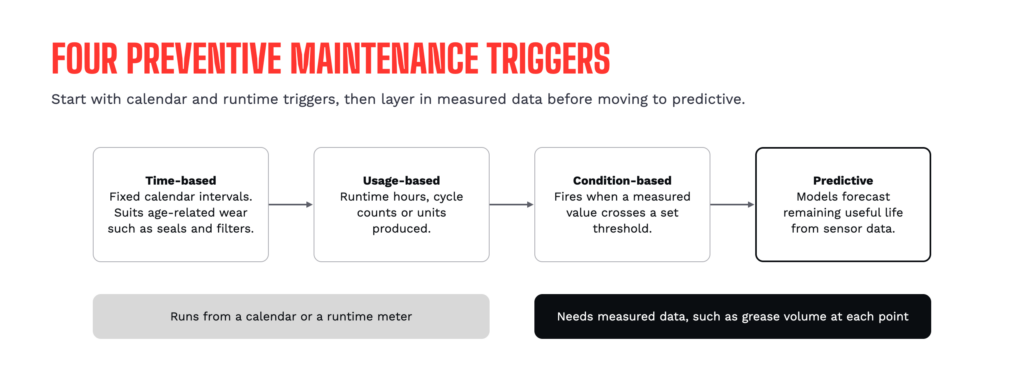
A strong PM schedule uses more than one trigger type. Matching each task to the right trigger improves coverage and saves labour.
Time-based triggers
Tasks run at fixed calendar intervals: daily, weekly, monthly or quarterly. This is the simplest trigger and the usual starting point for lubrication routes. It suits components with predictable age-related wear, such as seals, gaskets and filters.
The limitation is that a calendar ignores operating conditions. A conveyor running three shifts wears differently from one running a single shift.
Usage-based triggers
Tasks fire on operating hours, cycle counts or units produced. Runtime meters and production counters feed the schedule, so maintenance tracks how hard a machine actually works.
For motors, pumps, fans and gearboxes on a busy line, usage-based triggers often fit better than calendar ones, because wear follows load and runtime rather than days elapsed.
Condition-based triggers
Tasks fire when a measured value crosses a threshold: vibration, temperature, pressure, lubricant condition or grease volume delivered. This needs either manual inspection routes or installed sensors.
Condition-based lubrication monitoring avoids regreasing points that do not need it. It also catches deterioration that calendar and usage triggers miss.
Predictive triggers
Continuous sensor data feeds models that forecast remaining useful life. Predictive triggers are the most advanced option, but they depend on a solid preventive base. Without consistent, measured PM data, a model has no reliable baseline.
The sensible progression is to start with time and usage triggers, add condition-based monitoring, then move to predictive analytics once the data is in place.
How to build a preventive maintenance schedule in six steps
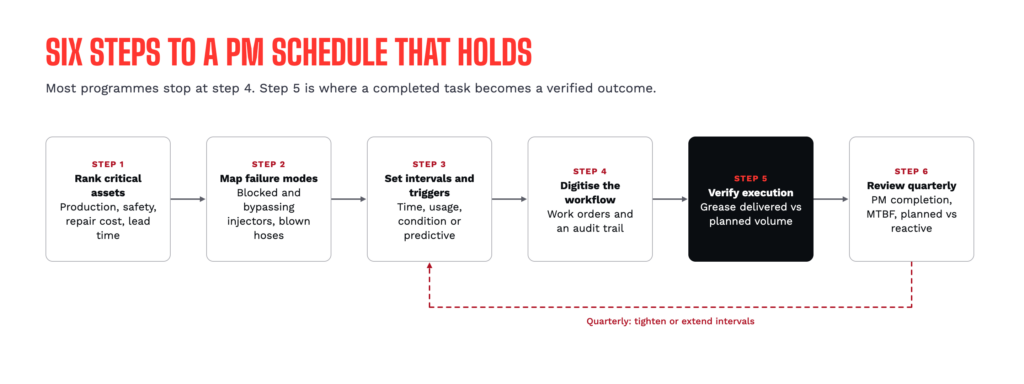
A PM schedule that holds up on the plant floor takes more than copying OEM intervals into a spreadsheet. These six steps give maintenance supervisors a structure to follow.
Step 1: Rank your critical assets
Start with the equipment that hurts most when it stops. Rank every asset by production impact, safety exposure, repair cost and spare-part lead time. As a rule of thumb, a small share of critical assets drives most of the downtime cost, so schedule those first.
For each critical asset, record every lubrication point, the grease type, the volume and the frequency. This becomes the backbone of your lubrication schedule.
Step 2: Map failure modes for each asset
One asset can fail in several ways, each needing a different maintenance strategy. A pump might suffer bearing wear, seal failure or electrical faults. A conveyor might have belt tracking issues, roller seizure or gearbox oil starvation.
For lubrication, be specific. List the ways your automatic lubrication systems can fail: blocked injectors, bypassing injectors, blown hoses, empty tanks and pump timer faults. Each failure mode gets its own detection method and task.
Step 3: Set intervals and match trigger types
Assign each task to a trigger: calendar, runtime, condition threshold or predictive model. For lubrication, OEM specifications give a starting point for grease volume and frequency.
Lean towards more frequent inspection and less frequent replacement, and watch for tasks that consume labour without ever finding a fault. Those are candidates to extend.
Step 4: Digitise the schedule and workflow
Paper schedules create compliance gaps. A digital system generates work orders, assigns technicians, tracks parts and keeps the audit trail your site needs for ISO and safety compliance.
For lubrication, the GreaseBoss Cloud holds your site’s lubrication schedule, mapped from location to asset to individual grease point, each with its grease type, volume and frequency. Reports and alerts are generated automatically when planned and actual volumes diverge.
Step 5: Verify execution, not just completion
This is where most PM programmes fall short. A completed work order is not a verified outcome, so the schedule needs a feedback loop that confirms each task did its job.
For lubrication, that means measuring the volume of grease that reached each monitored point. GreaseBoss Endpoints record this data and sync it to the GreaseBoss Cloud, which compares planned vs actual delivery and flags deviations automatically.
Step 6: Review and adjust quarterly
Every quarter, look at PM completion rate, schedule compliance, mean time between failures (MTBF), mean time to repair (MTTR) and backlog age. Drop tasks that never find problems. Tighten intervals on tasks that keep finding failures too late.
Your schedule should look noticeably different in 12 months. Continuous improvement is how a PM programme keeps reducing unplanned line stoppages.
Common lubrication failure modes your schedule must cover
Generic references to “equipment failure” do not help a maintenance team. Naming the specific ways lubrication systems fail makes each one checkable.
Blocked injectors
Grease thickens or contaminants build up inside the injector, so it stops dispensing during the pump cycle. The injector appears to cycle normally, but no grease reaches the bearing. Without flow measurement downstream of the injector, this fault is invisible.
Bypassing injectors
The injector fires, but grease takes the path of least resistance back through the return circuit instead of reaching the lubrication point. The pump reaches full pressure and the system looks healthy while the bearing runs dry.
Blown hoses downstream of injectors
Points exposed to vibration and impact, such as drive, pulley and motor bearings, are prone to hose damage. A ruptured hose dumps grease onto the floor instead of into the component. A blown hose shows up as missing flow at the Endpoint downstream of the injector.
Empty grease tanks
An empty reservoir is one of the simplest failure modes and one of the most overlooked. When the tank runs dry, the whole circuit stops delivering. With monitoring in place, an empty tank shows as no flow across every monitored point on that circuit. Endpoint Bulk Flow can also monitor pump output and tank filling.
Incorrect pump timer settings
A pump timer set too infrequently under-greases every point on the circuit. Bearings accumulate damage that does not show as a sudden failure but shortens their life well before design life.
How to verify lubrication in a PM schedule
Most plants run both automatic and manual greasing, often on the same line. Each needs its own way of proving that grease was delivered. GreaseBoss covers them with two separate solutions.
Automatic lubrication: Critical Point Monitoring
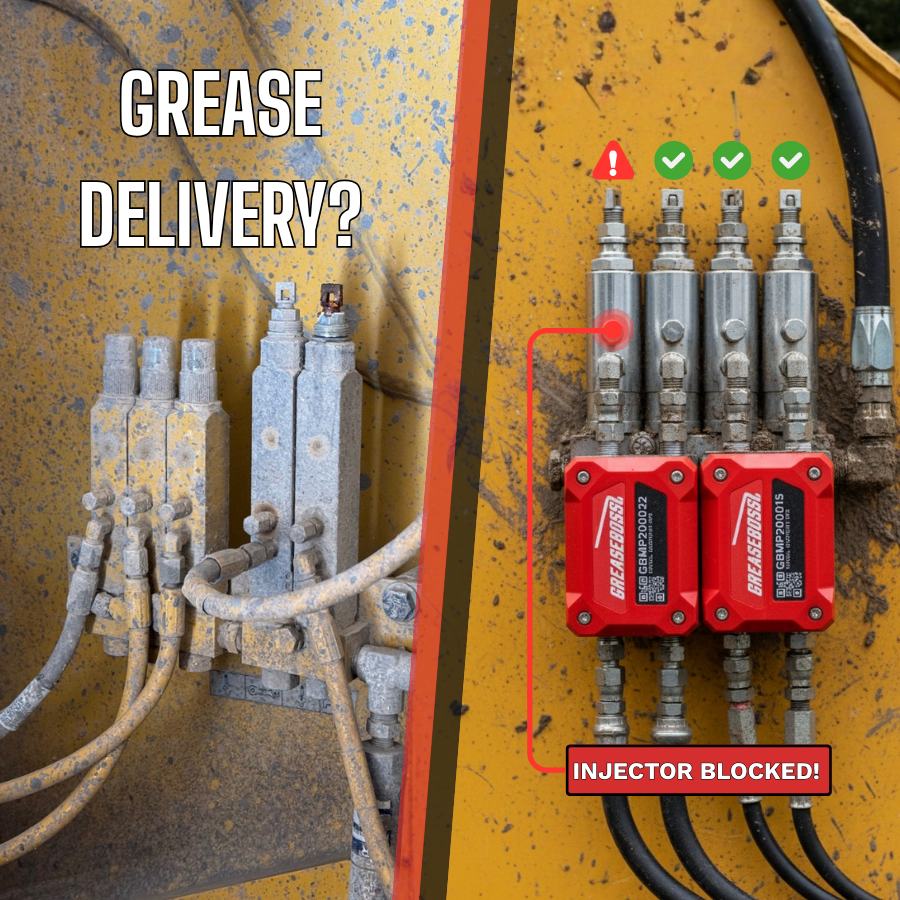
Critical Point Monitoring verifies that centralised and single-point automatic lubricators deliver the right volume of grease every time they run.
- A GreaseBoss Endpoint, a wireless, battery-powered flow meter, is installed downstream of the injector at each critical grease point.
- Each time the system pumps, the Endpoint measures the grease volume delivered and records when.
- A GreaseBoss Gateway passes the data to the GreaseBoss Cloud, which compares it against the target volume for that point.
- If delivery is out of spec (under-greasing, over-greasing or no flow), the GreaseBoss Cloud raises an alert in near real-time.
When a blocked injector is flagged soon after it fails, your team can raise a work order and fix it before the bearing is damaged. Without verification, the same fault waits for the next inspection, or for the bearing to seize.
Manual greasing: Manual Lubrication Management
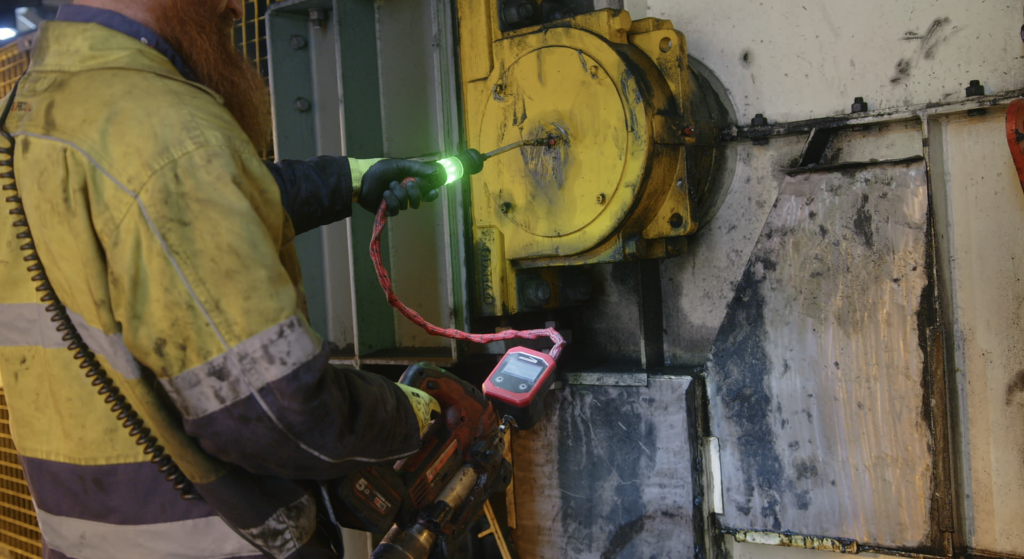
Motors, fans, pumps and many conveyor bearings are still greased by hand on a route. Manual Lubrication Management makes sure each of those points gets the right grease, in the right amount, at the right time.
- The site’s lubrication schedule (grease type, volume and frequency) is loaded into the GreaseBoss Cloud.
- Each grease point gets an RFID Grease Tag, mapped to its asset and point.
- A GreaseBoss Head Unit replaces the hose on a standard grease gun. It contains a flow meter, RFID reader, screen and onboard computer.
- Before a shift, the Head Unit downloads the latest route. On the route, it confirms each point by RFID, measures the grease applied, guards against under- and over-greasing and records completion.
- The data syncs back to the GreaseBoss Cloud for reporting and compliance tracking.
The result is a PM record that shows which points were greased and how much went in, not just which tasks were ticked off.
What verified data adds to your reliability programme
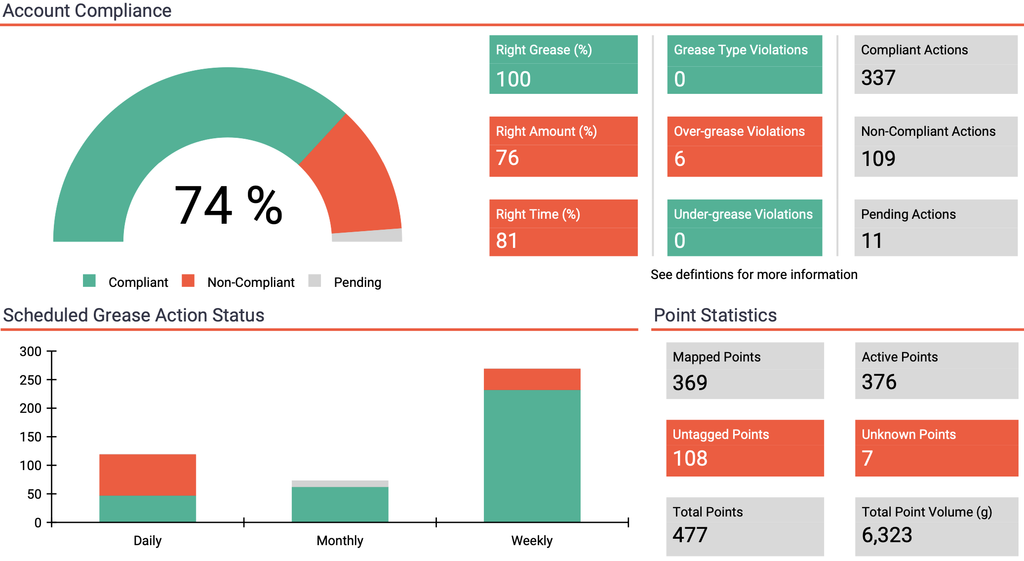
GreaseBoss Cloud dashboards show planned vs actual delivery in a simple format. Supervisors do not need specialist analysis skills to read them: the system highlights exceptions and gives your team the information it needs to raise a work order.
Over time, verified delivery history becomes part of your asset health baseline. When you know how much grease each point received over the past year, you can compare delivery against failure events and refine intervals. It is also the measured data that condition-based and predictive maintenance depend on.
KPIs that show your PM programme is working
The right KPIs separate a PM programme that improves from one that stalls after go-live. The targets below are common industry benchmarks, not fixed rules; set your own against your baseline.
| KPI | What it measures | Common benchmark |
|---|---|---|
| PM completion rate | Scheduled tasks finished | Above 90%; below 75% suggests the schedule is unrealistic for your crew |
| Schedule compliance | PMs completed within their due window | 85% or higher; consistently below 70% suggests an overloaded schedule |
| Planned to reactive ratio | Share of maintenance effort that is planned | 80/20; below 60/40 means the team is still firefighting |
| MTBF | Average run time between failures | Rising month on month |
| Lubrication compliance rate | Points that received the correct volume at the correct frequency, measured at the point of lubrication | Tracked from verified delivery data, not work order closures |
The last row is the one most plants miss. Measured at the point of lubrication, it shows the true health of the lubrication programme. Measured from closed work orders, it shows only that someone signed off.
These KPIs also feed overall equipment effectiveness (OEE). Fewer bearing failures mean fewer unplanned line stoppages, which lifts availability, the OEE factor most affected by maintenance.
How to move from reactive to preventive maintenance
If your plant runs mostly reactive, the shift to preventive maintenance happens in stages.
- Start with your five most critical assets. Build a time-based PM schedule around their failure modes and OEM recommendations, and run it for 90 days while tracking completion and any failures.
- Add lubrication verification on those same assets. Comparing planned grease volume with actual delivery shows faults the schedule alone cannot catch.
- Expand asset by asset. Each quarter, add the next tier of critical equipment until every asset with a real production or safety impact is covered.
On a Tier 1 gold mine’s SAG mill, GreaseBoss Critical Point Monitoring found three faults in its first three months: mistimed pumping to the trunnion points, severe under-greasing at the feed end bearings and a failed pinion injector. Each became a work order before it became a failure. A previous ball mill lubrication failure at the site had cost 9 days of downtime and AU$25 million in lost production.
PM scheduling for fixed plant
A manufacturing plant mixes conveyors, crushers, screens, electric motors, pumps, fans and gearboxes. Each has different lubrication needs, and many plants combine manual and automatic lubrication. Your schedule has to give every point the correct grease type, volume and frequency.
Fixed plant has one advantage: assets do not move, so lubrication routes stay consistent. The challenge is scale. A large plant can have thousands of grease points, which makes verification essential rather than optional.
Heavy mobile equipment needs a different approach, with intervals set on service meter units rather than calendar days. We cover that in preventive maintenance for heavy mobile equipment.
Build your PM schedule around verification, not assumption
Preventive maintenance compliance is only as good as your proof that the work achieved its purpose. For lubrication, that means measuring grease delivery at every critical point and comparing it with the plan.
Start with your most critical assets and map their failure modes. Set intervals from OEM recommendations and real operating conditions, then digitise the workflow. Verify execution with data rather than checkboxes, and review every quarter. The result is a schedule that prevents failures instead of recording them after the fact.
We give maintenance teams the visibility to close the gap between planned and actual lubrication. Contact us to see how verified grease data can strengthen your preventive maintenance programme.
FAQs about preventive maintenance compliance and scheduling
What is the difference between preventive and predictive maintenance in manufacturing?
Preventive maintenance uses scheduled tasks based on time, usage or condition triggers to prevent failures. Predictive maintenance uses continuous sensor data and analytics to forecast when a failure will occur. Predictive builds on a solid preventive base: without consistent PM data, models lack the baseline they need.
Why can preventive maintenance compliance be misleading?
Compliance is usually reported as the share of PM tasks closed on time. A closed task shows the work was signed off, not that it worked. A lubrication task can be closed while a blocked injector stops any grease reaching the bearing.
How does lubrication verification fit into a PM schedule?
Lubrication verification confirms that each point received the correct volume of grease, not just that the task was marked complete. GreaseBoss measures delivery at the point of lubrication and compares it with the planned volume, flagging deviations automatically.
What are the most common lubrication failures in manufacturing equipment?
The most common are blocked injectors, bypassing injectors, blown hoses downstream of injectors, empty grease tanks and incorrect pump timer settings. Each can lead to bearing damage or seizure if missed. GreaseBoss Critical Point Monitoring flags these faults in near real-time.
How often should manufacturers review their PM schedules?
Quarterly is the usual cadence. Each review should cover PM completion rate, MTBF trends and the planned to reactive ratio. Verified lubrication data shows which intervals need tightening and which tasks can safely be extended.
Can small manufacturing plants benefit from PM scheduling?
Yes. Smaller plants have less capacity to absorb unplanned downtime, and one critical asset failure can stop all production. GreaseBoss provides lubrication data within one day of installation [check: confirm with marketing], so a plant of any size can start verifying grease delivery quickly.